|
  • Blog

meet maacis: Complaints module - quality management par excellence

Functioning and automated quality management in leaflet distribution is a decisive success factor. In the second part of our meet maacis series, we explain how you can use our Customer Insights Suite maacis to achieve maximum transparency about the current volume of complaints.

meet maacis Anzeige Desktop

Despite the high quality of delivery, it is normal for complaints to arise in the leaflet business. This is because recipients immediately notice if the popular medium is missing from their letterbox. The consistent processing and optimisation of the complaints process is of central importance here, and our Customer Insights Suite maacis helps with the "Complaints" module.

Everything at a glance

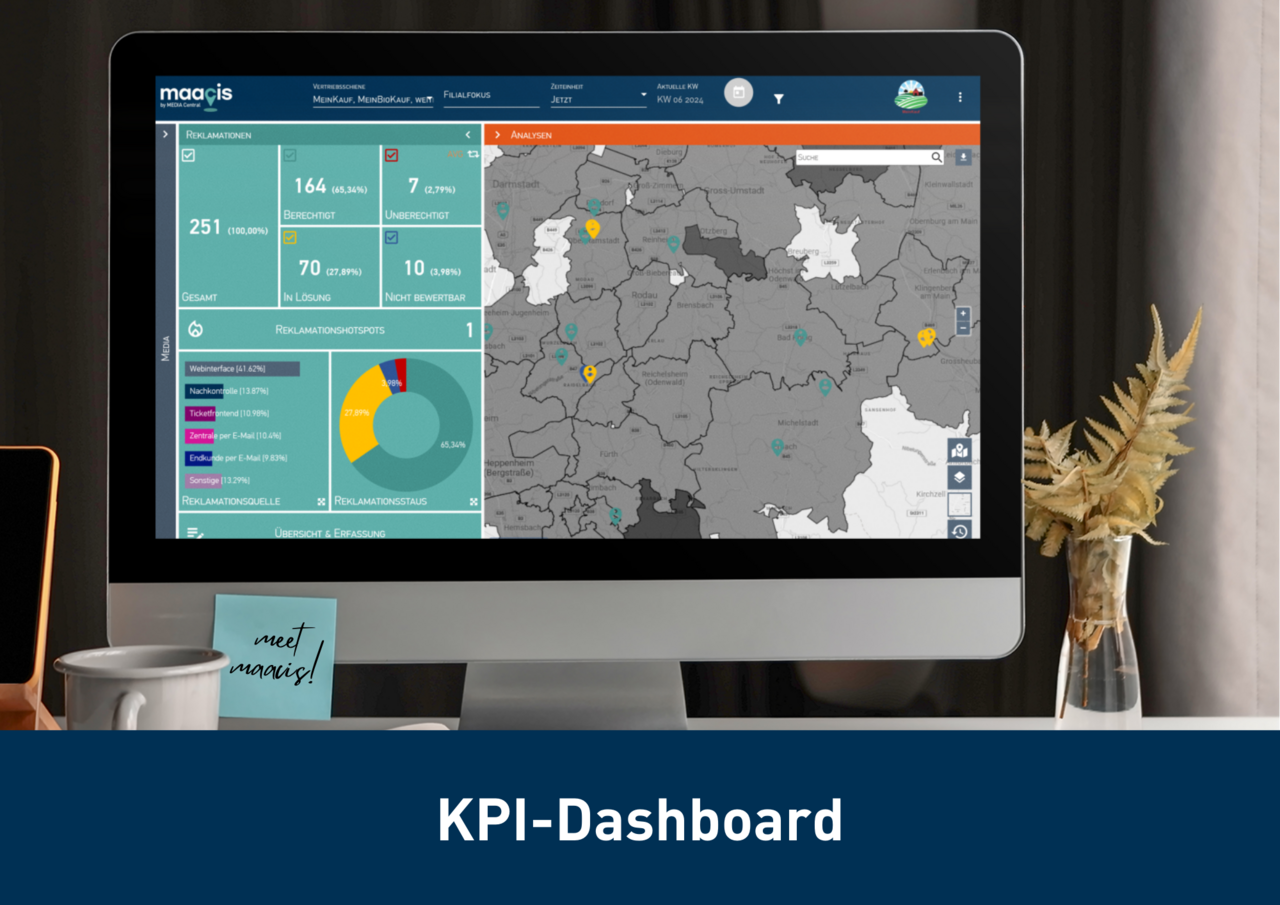
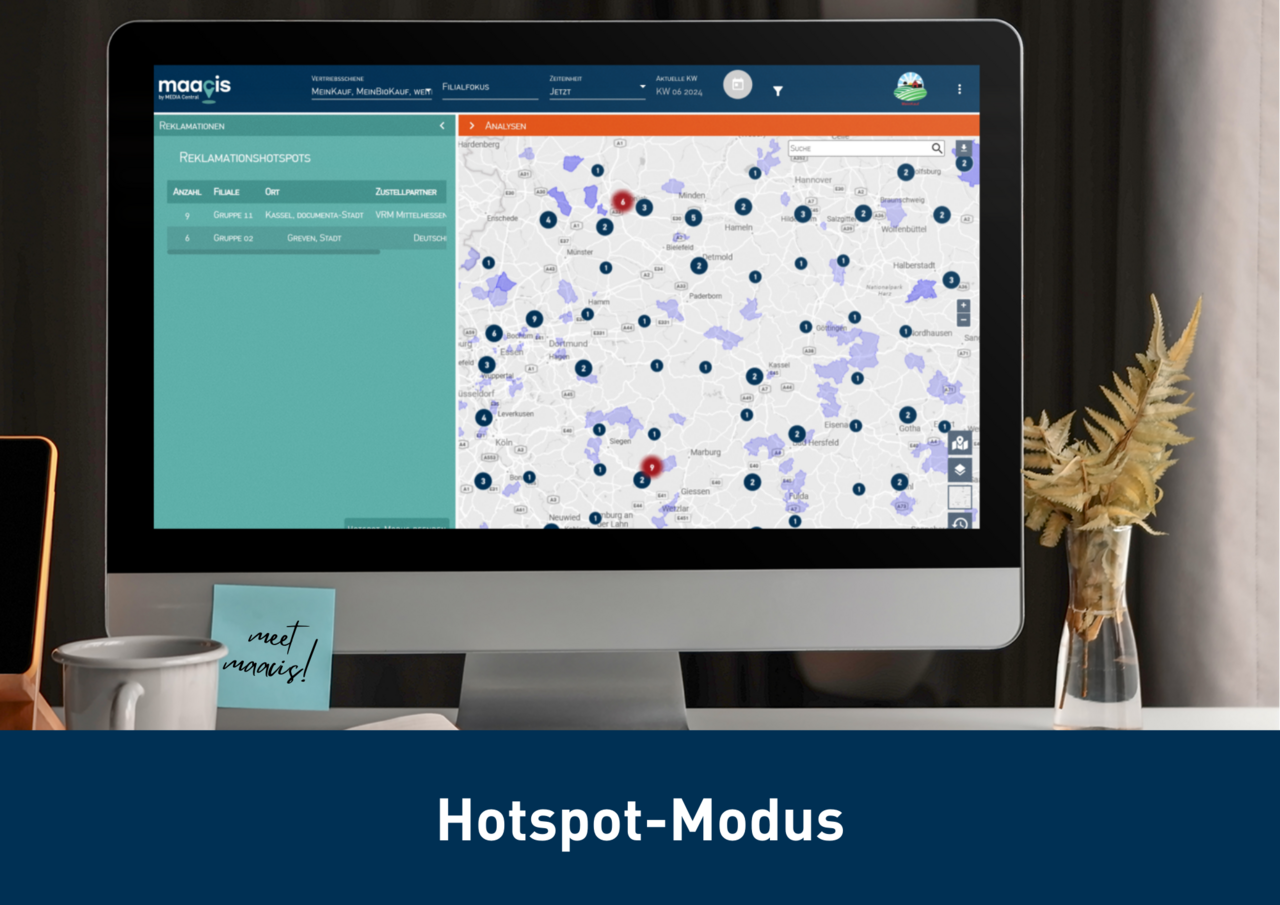
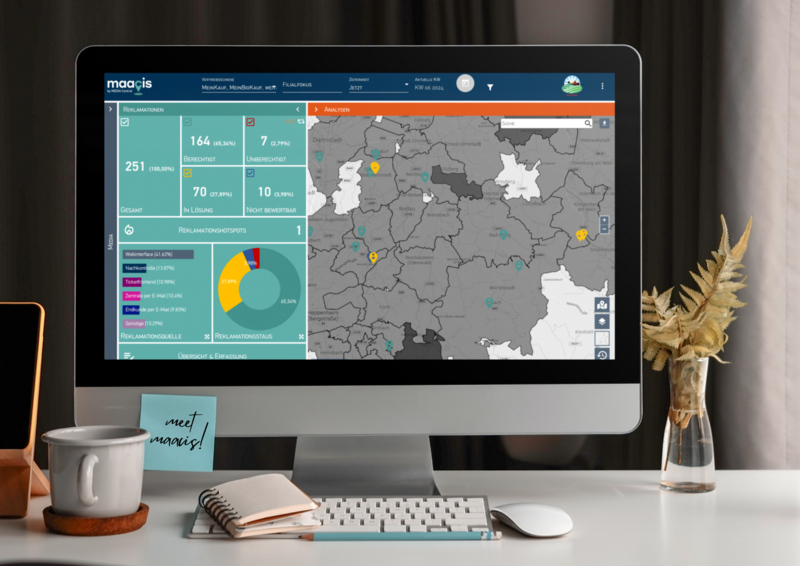
With maacis, you always have an overview of your current complaints volume. The complaints module of the Customer Insights Suite shows you the most important quality KPIs according to processing status and complaint source in a clear dashboard visualisation. By clicking on the corresponding status tiles, the complaints can be summarised or filtered by status in the map display.

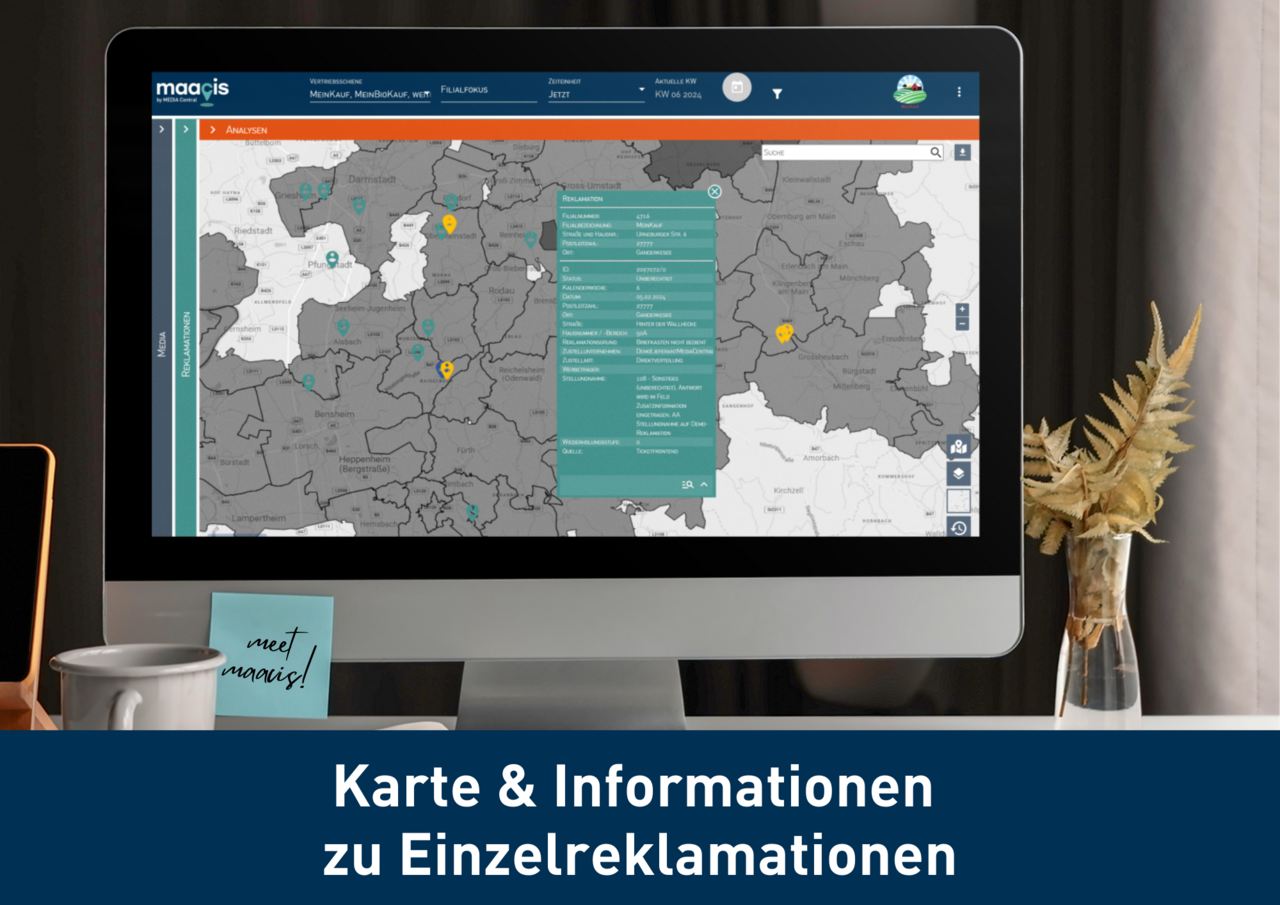
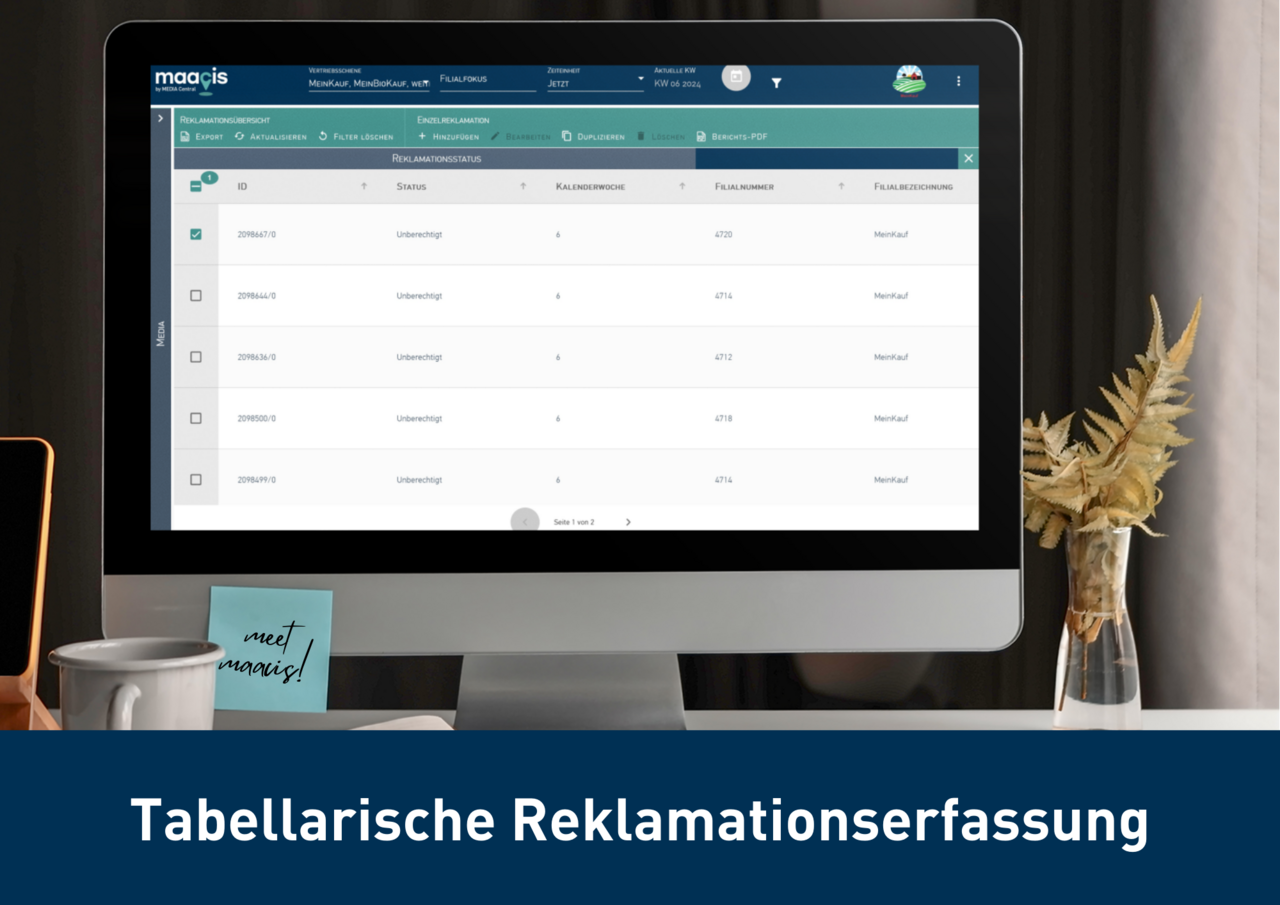
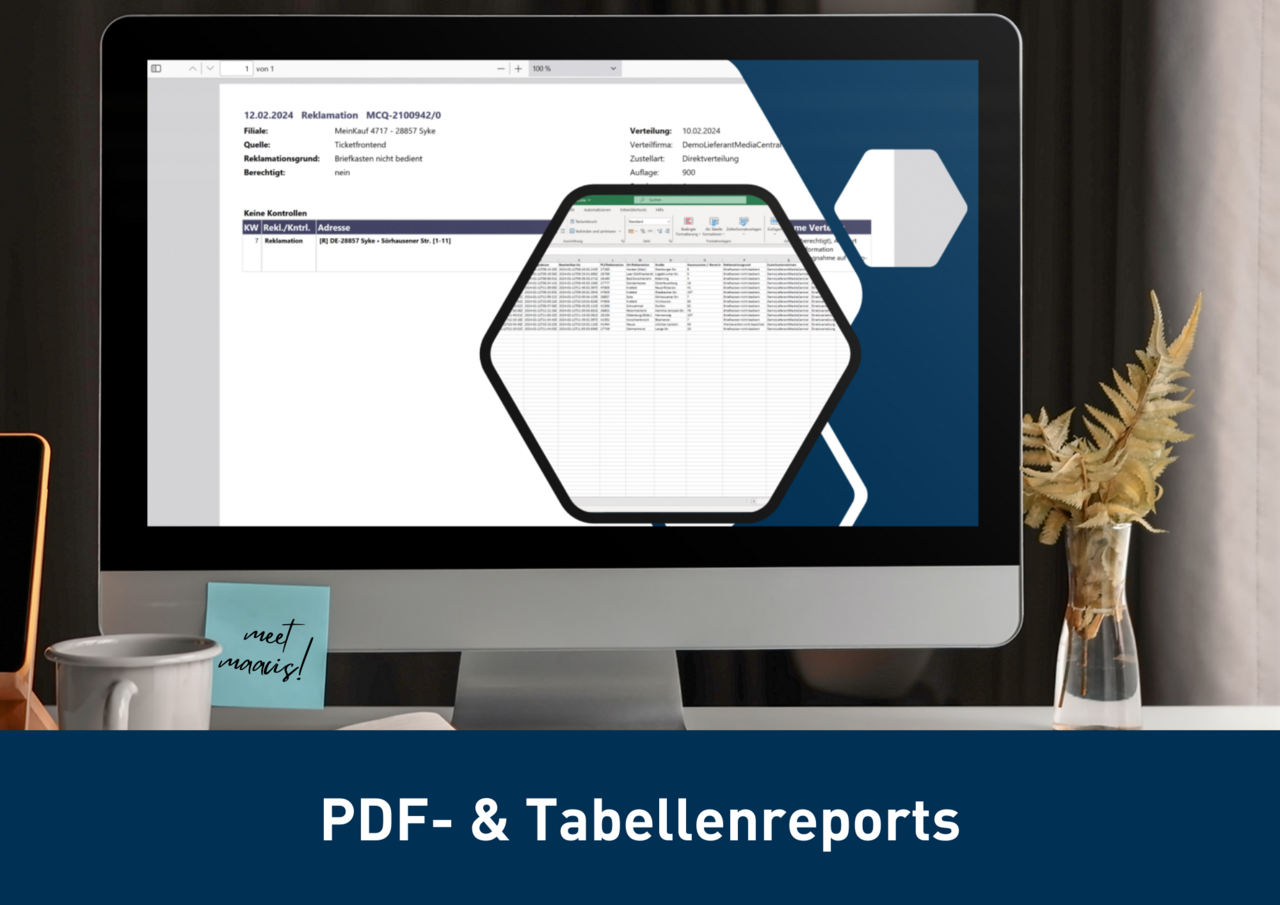
Maacis provides information on individual complaints such as branch affiliation and the reason for the complaint. Comments can also be called up by clicking on the card pin. The "Overview & recording" function can be used to open a tabular overview of the current complaint volume, which can also be sorted, searched and filtered.

Deep dive and focus

With the help of the Time Machine function, the number of complaints can also be analysed over time. Using the slider, complaints can be quickly and easily displayed, compared and analysed in the map view and with the help of the quality KPIs for previous calendar weeks, months or quarters.

The hotspot mode as part of the dashboard shows you immediately where the complaint volume for the selected period was so concentrated that a certain threshold value was exceeded. With a click, all complaints for a hotspot are visible on the map and further information such as the distribution area or distribution company is displayed.

Always the right report

In addition to interactive analyses via the dashboard and map view, your complaint data can also be bundled via table export and exported as a report PDF for individual complaints. This gives you the option of storing the data or processing it in your systems to carry out your own specific analyses.

Did you miss the first part of meet maacis? Click here for the article.